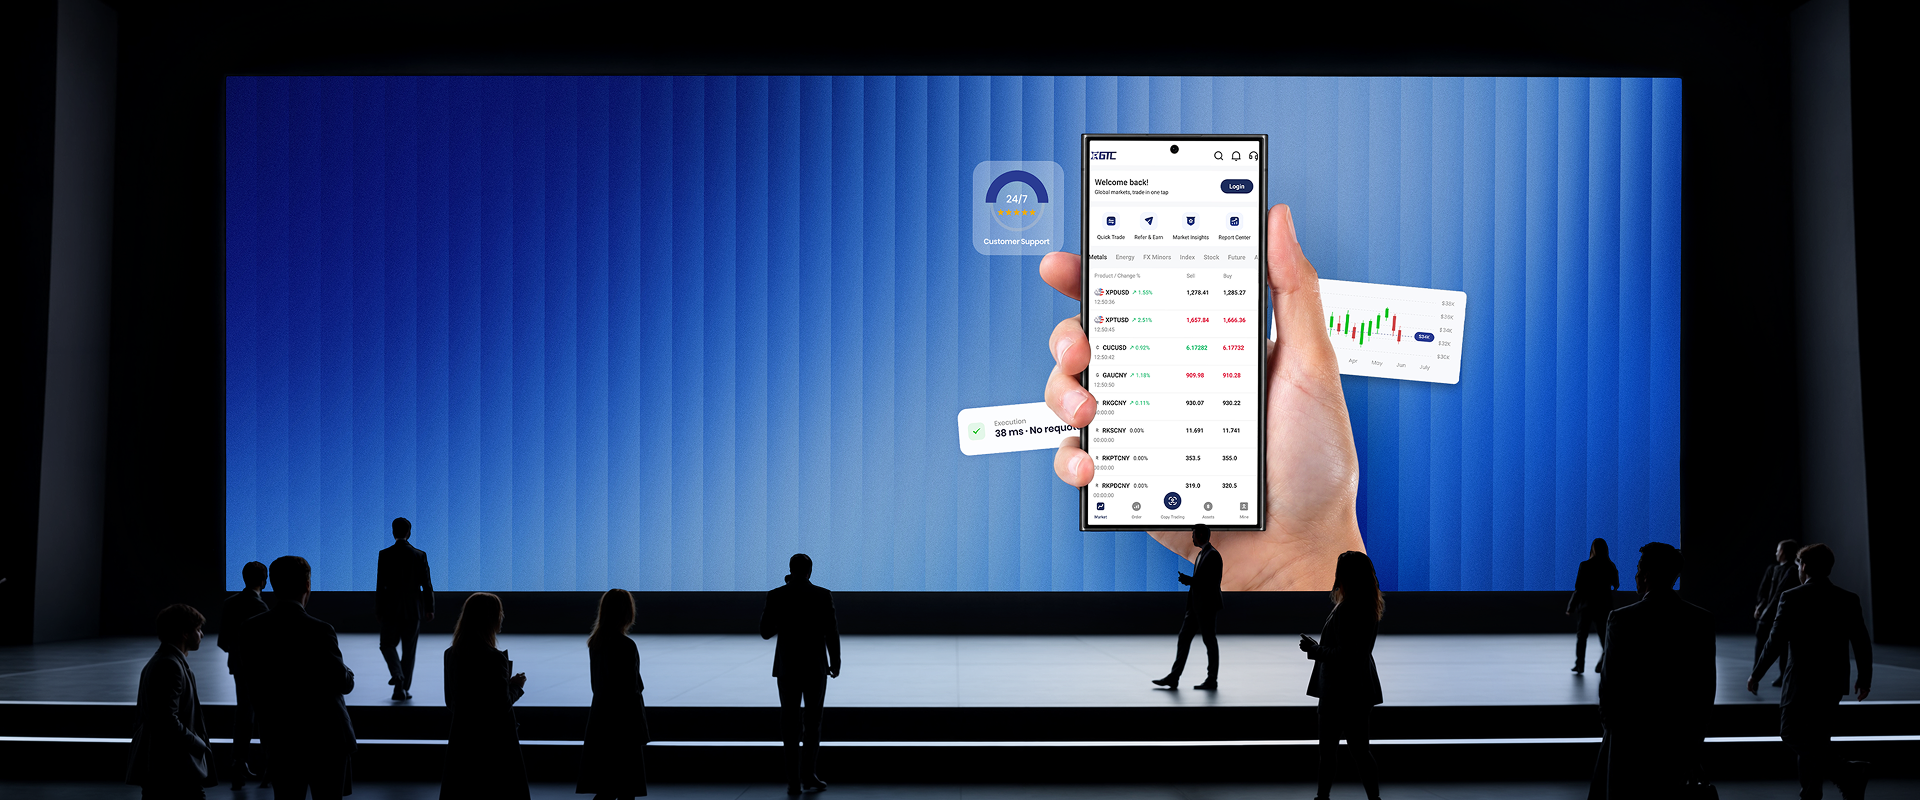
In modern financial markets, traders rely on technology to analyze price movements and make informed decisions. A CFD trading app provides convenient access to global markets while offering essential tools for market analysis. Among these tools, charts and technical indicators play an important role in helping traders understand trends, identify potential opportunities, and manage trading strategies.
With the development of the mobile trading app, traders can now analyze markets directly from smartphones and tablets without depending entirely on desktop platforms. GTCFX provides GTC Go, a mobile trading solution designed to support users with market access, real-time information, and trading tools that help traders monitor market conditions more efficiently.
Understanding Charts in a CFD Trading App
Charts are one of the most important features available in a CFD trading app. They provide a visual representation of price movements over a specific period, allowing traders to study market behavior and identify possible trends.
Different chart types can be used depending on a trader’s analysis approach. Line charts provide a simple view of price changes by connecting closing prices over time. Bar charts display more detailed information, including opening, highest, lowest, and closing prices within a selected period. Candlestick charts are widely used because they present price movements in a clear visual format and help traders evaluate market sentiment.
A professional trading app should provide flexible chart settings, allowing users to adjust timeframes, compare price movements, and apply analysis tools according to their strategies. Through GTC Go by GTCFX, traders can access market charts and monitor price changes across different financial instruments through a mobile interface.
Why Technical Indicators Matter for Traders
Technical indicators are mathematical tools that analyze historical price data to help traders evaluate market conditions. They do not predict future results, but they can provide additional information when combined with proper risk management and market research.
Many traders use indicators to identify trends, measure momentum, and understand possible changes in market direction. A mobile trading app with integrated indicators allows users to perform technical analysis even when they are away from their main trading setup.
For example, moving averages can help traders identify the general direction of a market trend. When prices remain above or below a moving average, traders may use this information as part of their market evaluation. The Relative Strength Index, commonly known as RSI, can help traders analyze price momentum and understand whether an asset may be experiencing strong buying or selling pressure.
Common Technical Indicators Available on Trading Apps
A well-designed CFD trading app usually provides access to several commonly used technical indicators. Each indicator serves a different purpose, and traders often combine multiple tools to create a more complete market view.
Moving averages are among the most widely used indicators because they help reduce short-term price fluctuations and highlight broader trends. Traders may compare different moving averages to study potential trend changes.
The MACD indicator is another popular tool used to analyze momentum and possible trend shifts. It compares different moving averages and presents information that traders can use when evaluating market direction.
Bollinger Bands are often used to measure market volatility. They consist of a middle moving average and upper and lower bands that expand or contract based on price movement. Traders may use them to understand periods of higher or lower volatility.
Support and resistance levels are also important concepts in technical analysis. While not always considered traditional indicators, they help traders identify price areas where market movements may slow down or change direction.
Using Charts and Indicators on a Mobile Trading App
The main advantage of a mobile trading app is accessibility. Traders can review charts, apply indicators, and monitor positions without being connected to a computer.
When using technical tools on a smartphone, simplicity and efficiency become especially important. A good mobile platform should provide clear chart displays, easy indicator selection, and smooth navigation. This allows traders to focus on analysis rather than spending too much time adjusting settings.
GTC Go by GTCFX is designed to provide traders with access to market analysis tools through mobile devices. Users can monitor price movements, review charts, and manage trading activities through an application built for flexible market access.
However, traders should remember that indicators are tools rather than guarantees. Successful trading decisions require combining technical analysis with market knowledge, risk management, and an understanding of economic factors that may influence prices.
Combining Technical Analysis with Risk Management
While charts and indicators can support trading decisions, managing risk remains an essential part of CFD trading. Market prices can change quickly, and traders need to consider their risk exposure before opening positions.
Many traders use technical analysis to determine possible entry and exit points, but they also establish risk management plans to control potential losses. Features such as stop loss and take profit orders can help traders manage positions according to their individual strategies.
A reliable CFD trading app should make these functions easy to access. By combining analytical tools with responsible risk management, traders can create a more structured approach to market participation.
Choosing a Trading App for Technical Analysis
When selecting a CFD trading app, traders should consider whether the platform provides the tools needed for their trading style. Important factors include chart functionality, available indicators, market coverage, execution experience, and overall usability.
For beginners, an intuitive interface can make it easier to understand charts and gradually develop technical analysis skills. For experienced traders, advanced chart features and flexible tools may be more important when applying established strategies.
A mobile trading app should balance professional functions with convenience. The ability to analyze markets, monitor positions, and access trading tools from anywhere can provide greater flexibility for modern traders.
Making Better Trading Decisions with Mobile Analysis Tools
Charts and technical indicators have become essential components of digital trading platforms. With the support of a CFD trading app, traders can access analytical tools that help them understand market movements and evaluate potential trading opportunities.
As mobile technology continues to develop, trading apps are becoming more capable of supporting different levels of trading experience. By using charts, technical indicators, and risk management features together, traders can build a more informed approach to navigating global markets. Platforms such as GTC Go by GTCFX provide convenient access to these tools, helping users stay connected with financial markets through a professional mobile trading environment.